Build Your Biohacker Dashboard
Turn your labs into a dashboard. See what is changing.
Drop your email and I’ll send you the guide.
Six copyable prompts build your charts and update them as new reports arrive. Includes practice data and example dashboards. No coding experience needed.
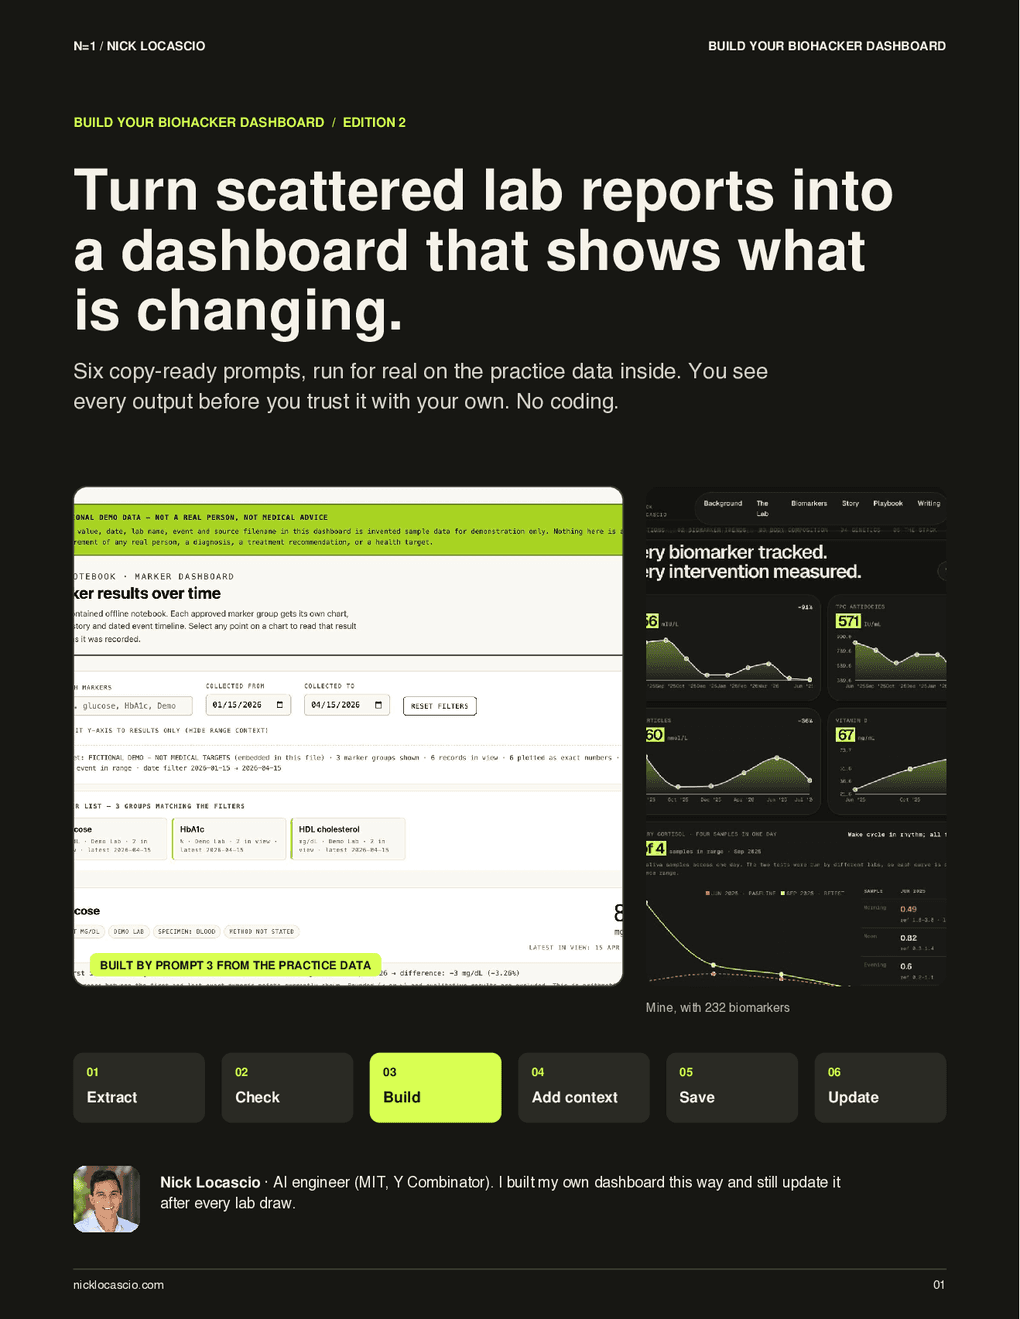
Here’s what you get.
- 01
This is what the prompts built
The dashboard Prompt 3 produced from the practice data, with each part labeled.
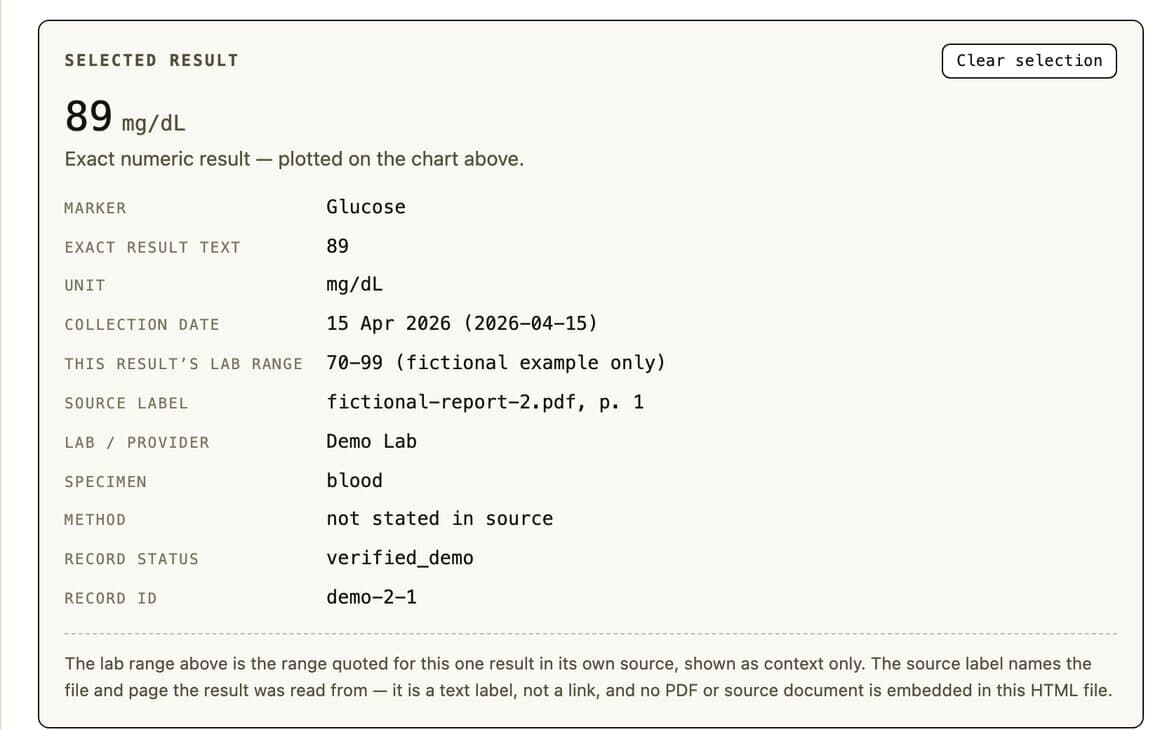
- 02
Tap a point, see its receipt
The exact result, its own lab range and the report page, plus the checks only you can run.
- 03
The update that tried to break it
A new unit and a "<0.2" result. Six records plus four new made ten, with zero duplicates.
REAL OUTPUT, NOT A MOCKUP
This is what the prompts built.
I ran all six prompts on the practice data in the kit. The guide shows every answer, and you can open the finished dashboards yourself before you trust the process with your own reports.
Open the example dashboard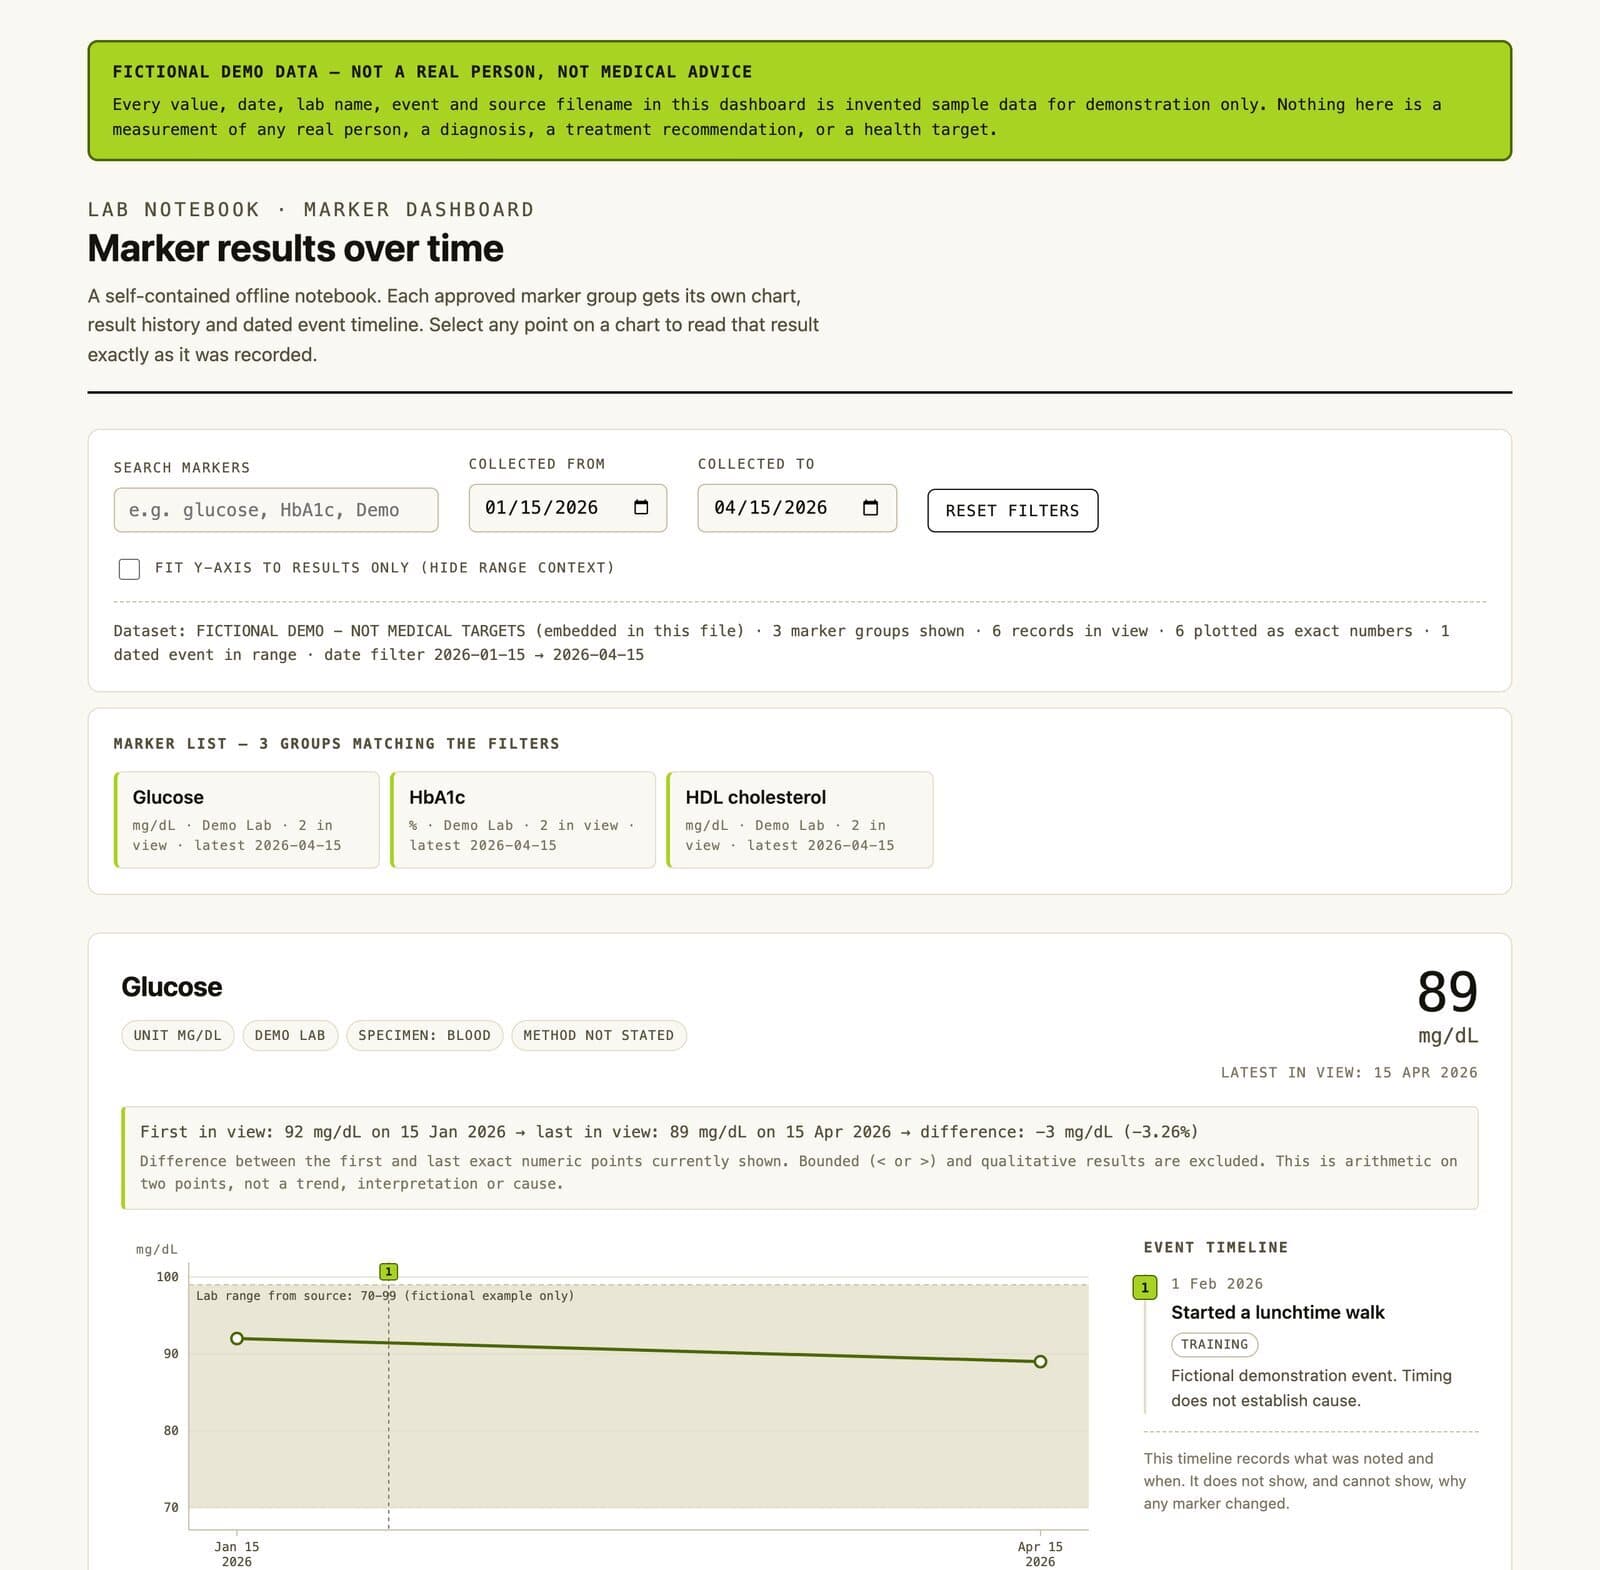
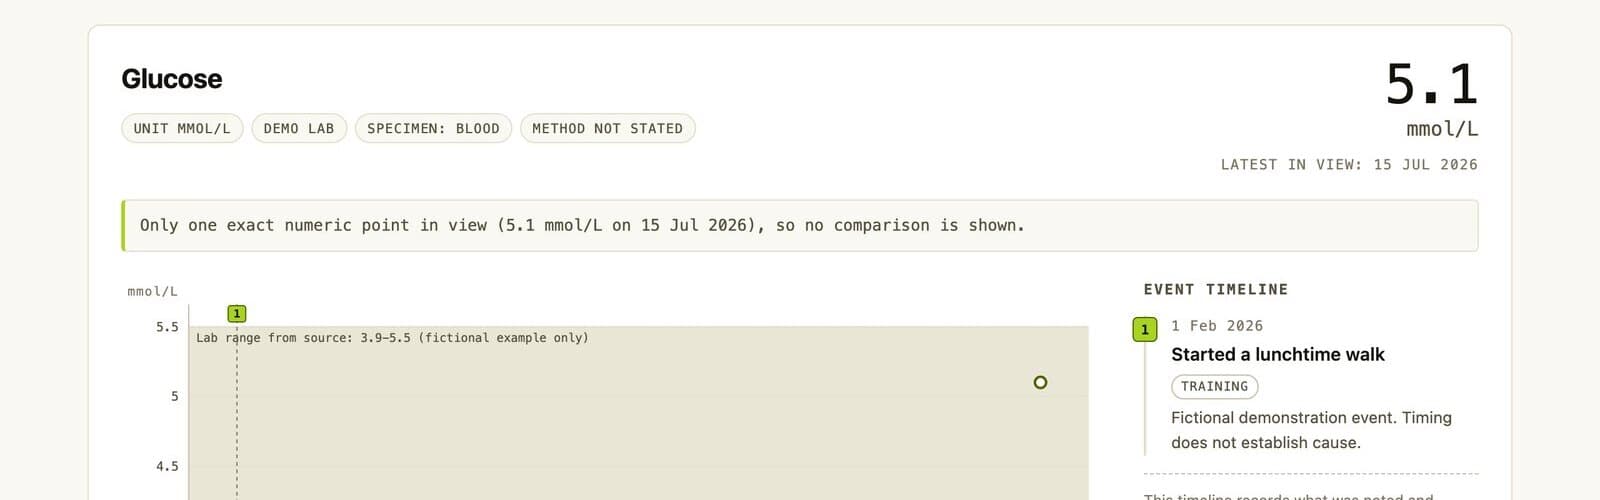
- 6 + 4 = 10The July report added four results. Zero duplicates, zero overwritten.
- mmol/LA glucose result in a new unit got its own chart instead of a silent conversion.
- <0.2A bounded result stayed in the table and off the chart.
- 146Automated checks the build ran on itself, plus the five it said only you can do.
THE SIX STEPS
Six prompts. One dashboard you own.
- 01
Extract
Your reports become a review table with dates, units, ranges and the page each number came from. No charts yet.
- 02
Check
A second pass compares every row with the report. You approve the table, not the model.
- 03
Build
One self-contained HTML file. It opens in a browser, works offline, and belongs to you.
- 04
Add context
Dated notes for when you changed something, shown beside every chart.
- 05
Save
The HTML and its data.json, every time. A preview is not a backup.
- 06
Update
Add the next report without losing history. Duplicates are caught, not doubled.
Look inside first
Three real pages, before you give an email.
No sign-up to see these. They are unedited pages from the 16-page PDF, so you can judge the guide instead of a cover.
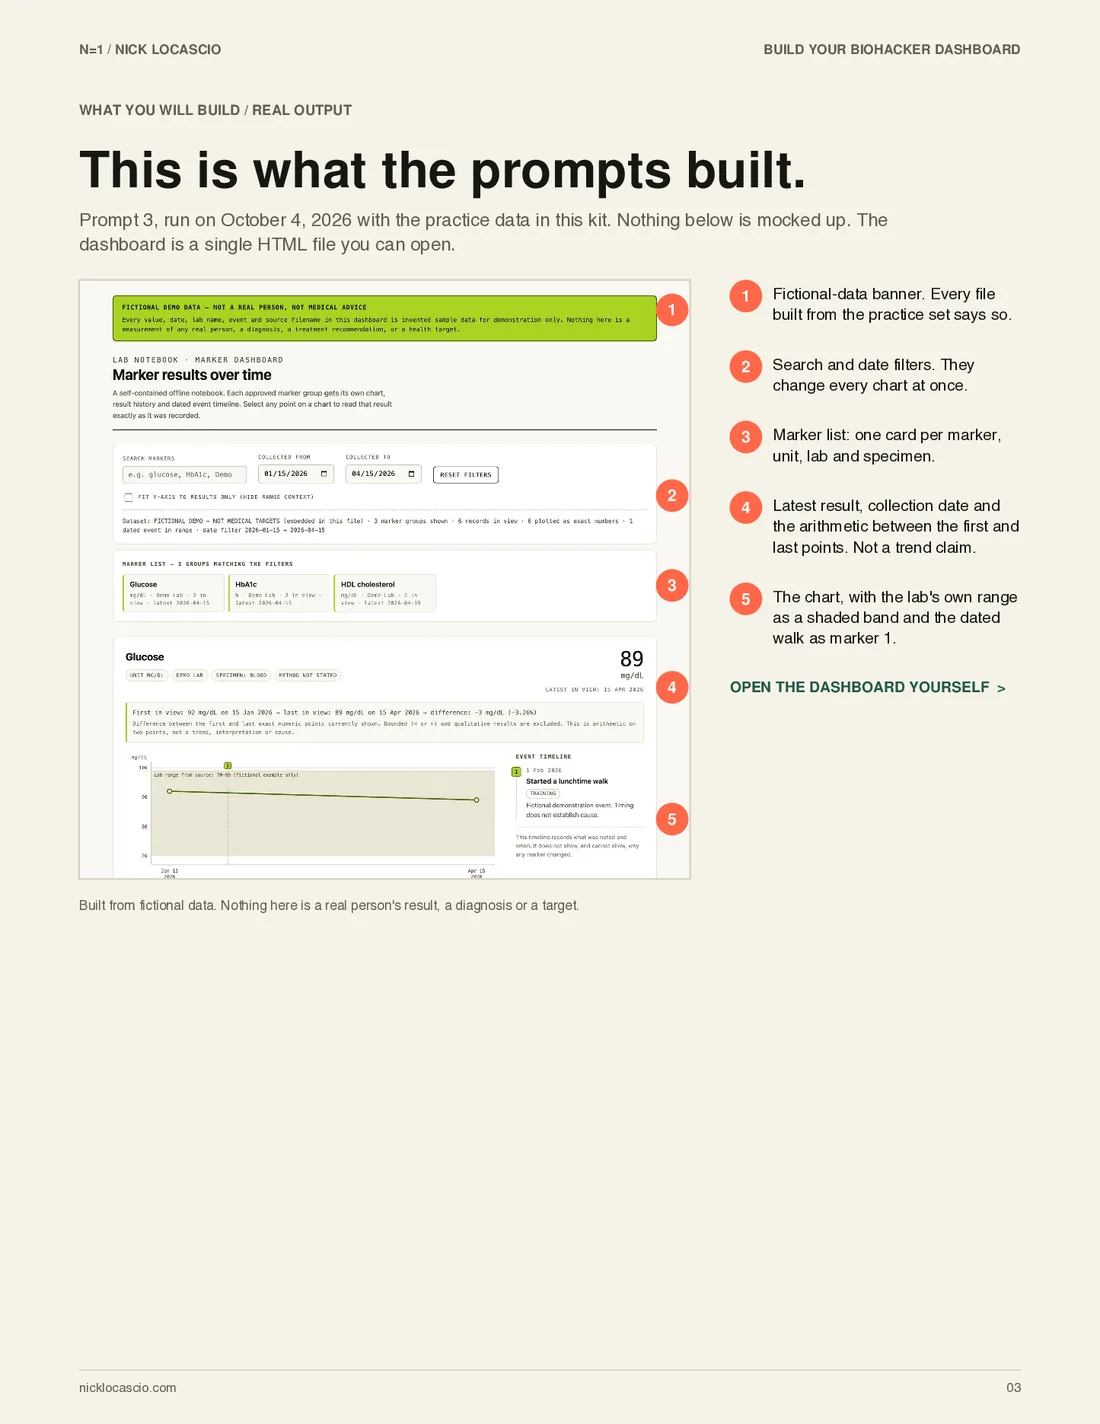
This is what the prompts built
The dashboard Prompt 3 produced from the practice data, with each part labeled.
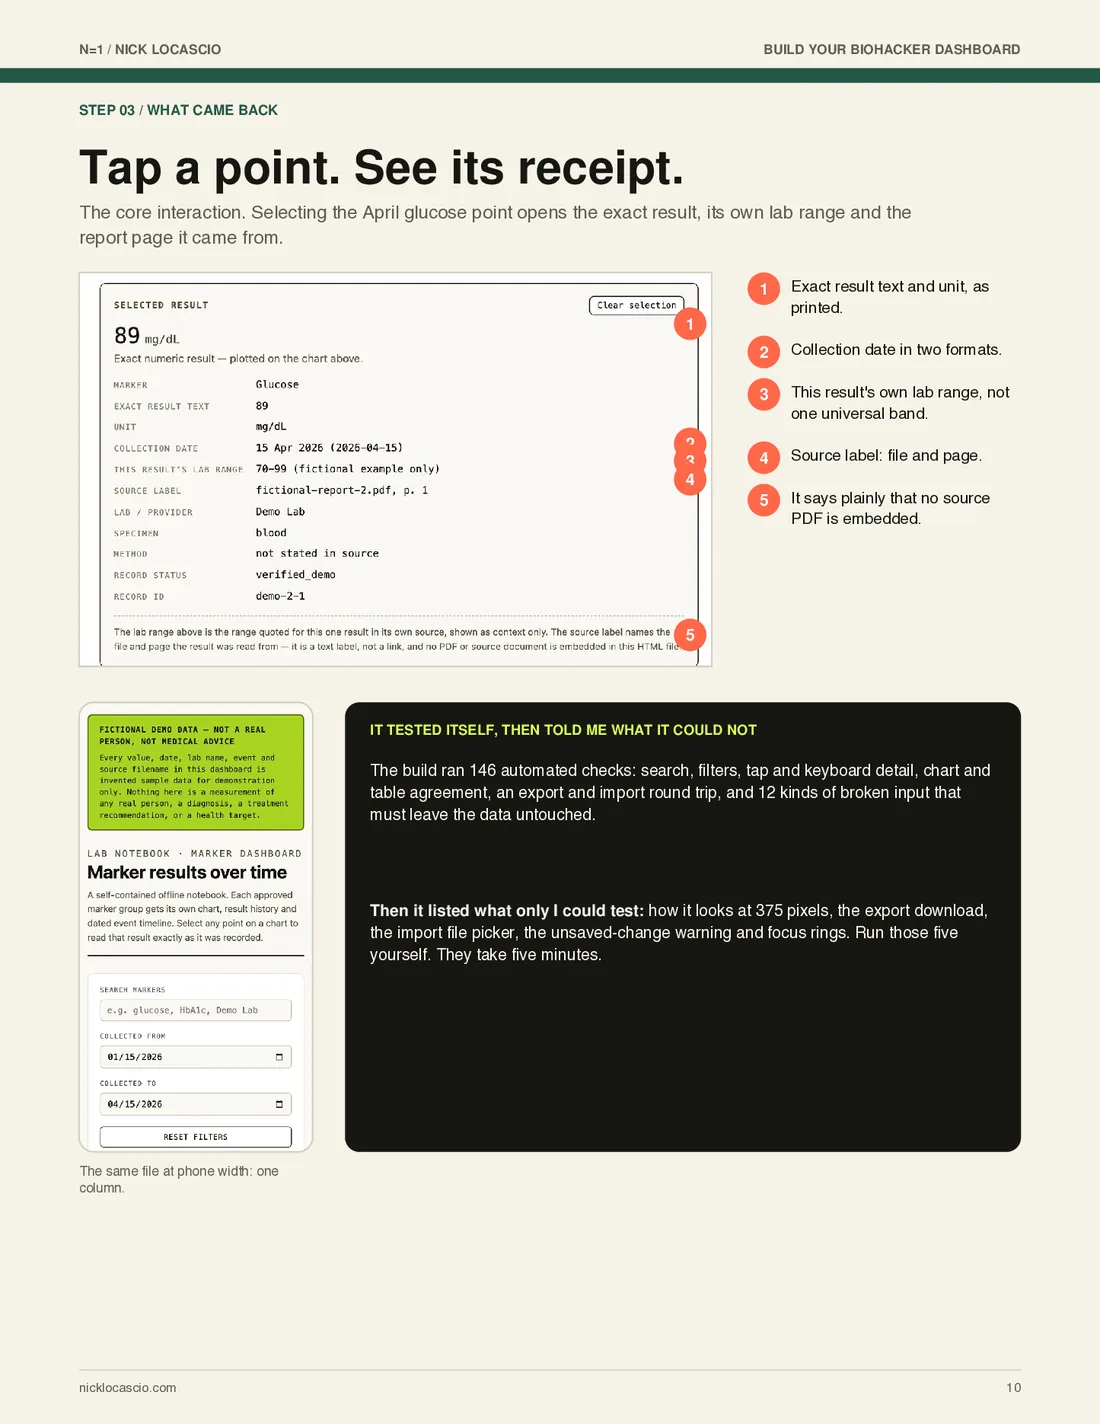
Tap a point, see its receipt
The exact result, its own lab range and the report page, plus the checks only you can run.
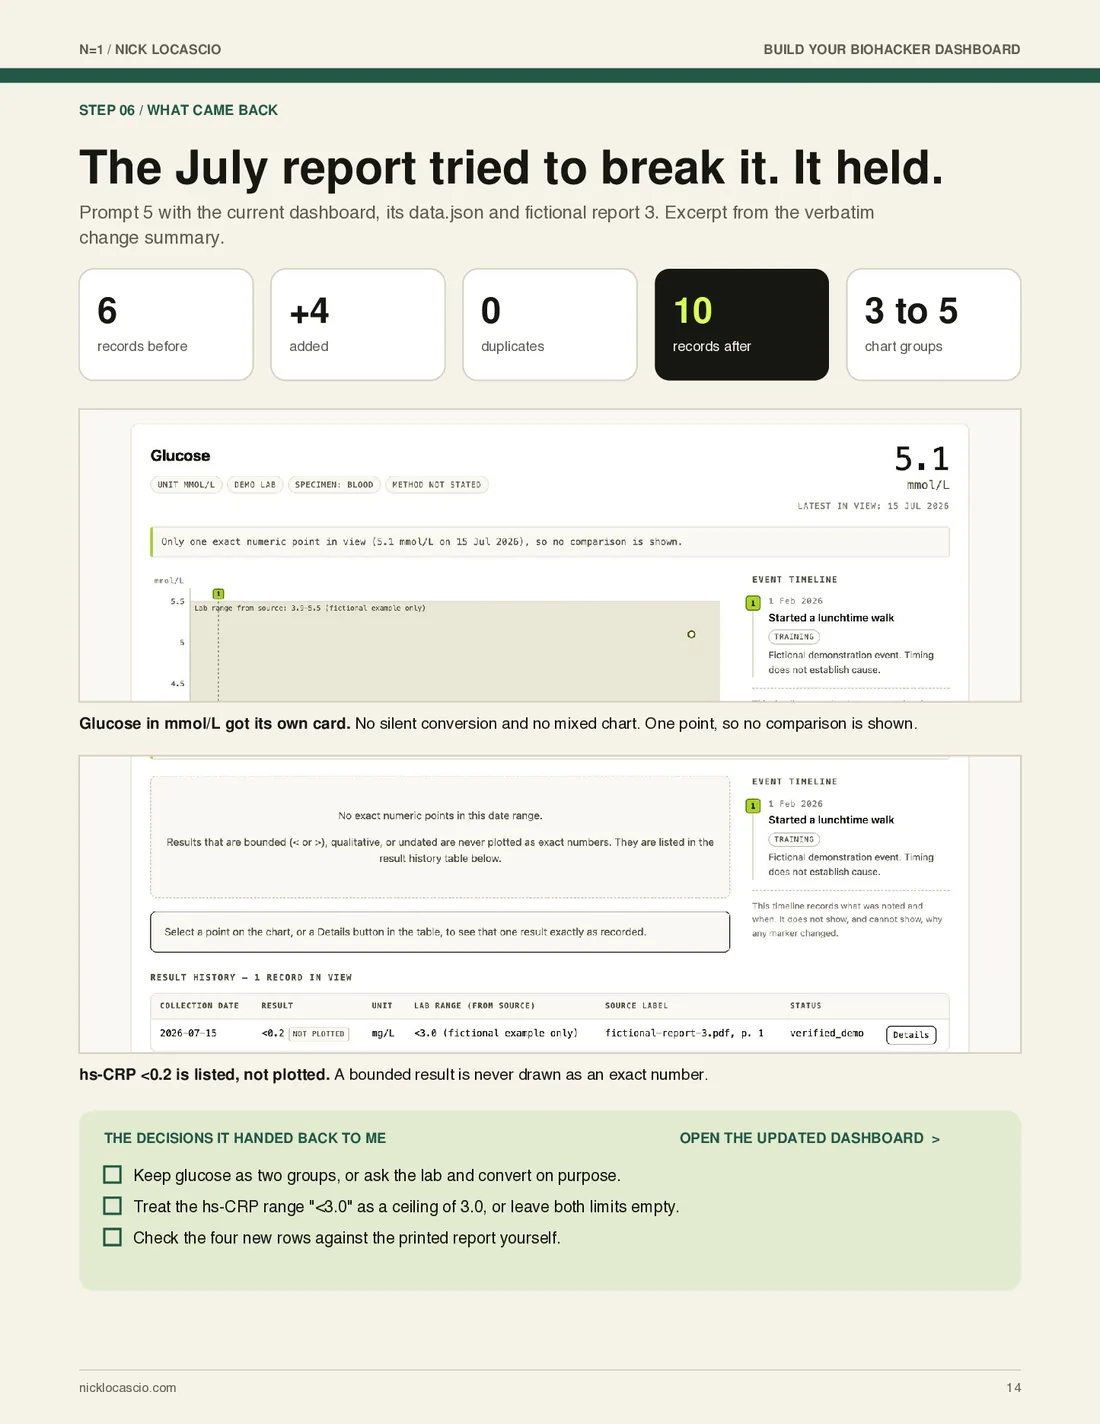
The update that tried to break it
A new unit and a "<0.2" result. Six records plus four new made ten, with zero duplicates.
WHAT COMES WITH IT
Practice on fake data
before you decide what to share.
Uploading real reports to a hosted AI tool shares them with that provider. The kit ships a fictional dataset so you can see whether the output is trustworthy before that choice is in front of you.
- Six copyable prompts, in order
- The real outputs: the review table, the dashboard, and the update
- A fictional practice dataset to build with first
- Acceptance checks and repair prompts for a broken result
- A specification for what a useful chart actually shows
GET THE KIT
See what actually moved.
Two reports is enough to start. The dashboard grows with your history.
Honest fit
Who this helps, and who should skip it.
Worth your time if
- You have lab reports in PDFs and portals and cannot see a trend across them.
- You want a file you own and can reopen, rather than another account.
- You are willing to practice on fictional data first.
Skip it if
- You want an app. This builds a single HTML file with an AI tool.
- You want the charts interpreted for you. The kit builds the view; reading it is your job and your clinician’s.
Before you download
The questions people actually ask.
Do I need to know how to code?
No. You copy six prompts into an AI tool and it writes the file. The guide includes the checks that catch a wrong number and the repair prompts for when the output is broken.
Do I have to upload my real results?
Not to try it. A fictional practice dataset ships with the kit, and the guide recommends building with that first. Uploading real reports to a hosted tool shares them with that provider, which is your call to make knowingly.
What do I end up with?
One self-contained HTML file with your results charted over time, dated notes for when you changed something, and a way to import new results. It opens offline and it does not belong to a company.
Why is it free?
Because I want more people running careful experiments on themselves, and because some readers eventually become Rebody Health customers. That is the whole model. No upsell arrives with the guide.
What happens to my email address?
You get the guide, then AI Biohacking, which is what I am testing and measuring on myself. You also get the revised guide whenever the research changes. One click unsubscribes and the address is never sold or shared.
What you are getting
1,000+ people already have this guide.
- 6 copyable prompts
- Real outputs from a test run
- Two example dashboards to open
- No coding experience needed
- Last checked
- October 4, 2026. I rebuild the dashboard when the AI tools change, and revise the guide when a prompt stops producing a working file.
- When it changes
- The revised guide goes to everyone on the list. You do not have to come back for it.
- Who wrote it
- Nick Locascio. AI entrepreneur, founder of Rebody Health, co-founder of Booth AI (YC). My health experiments are personal experience, not medical advice. See the work behind it.
The rest of the field guides
Every one is free, and built the same way.
An educational software-building resource. The kit builds the view; reading what the numbers mean is for you and a qualified clinician.
Explore my actual dashboard